Scheduled reports are only useful if you can trust what went out. You set up a report to send every Monday at 09:00, with a regional filter and a conditional rule, and then you move on. Most of the time it just works. But when someone asks "which date range did last month's report actually use?" or "why didn't the KPI report send on Tuesday?", you need answers fast, and you need them to be accurate.
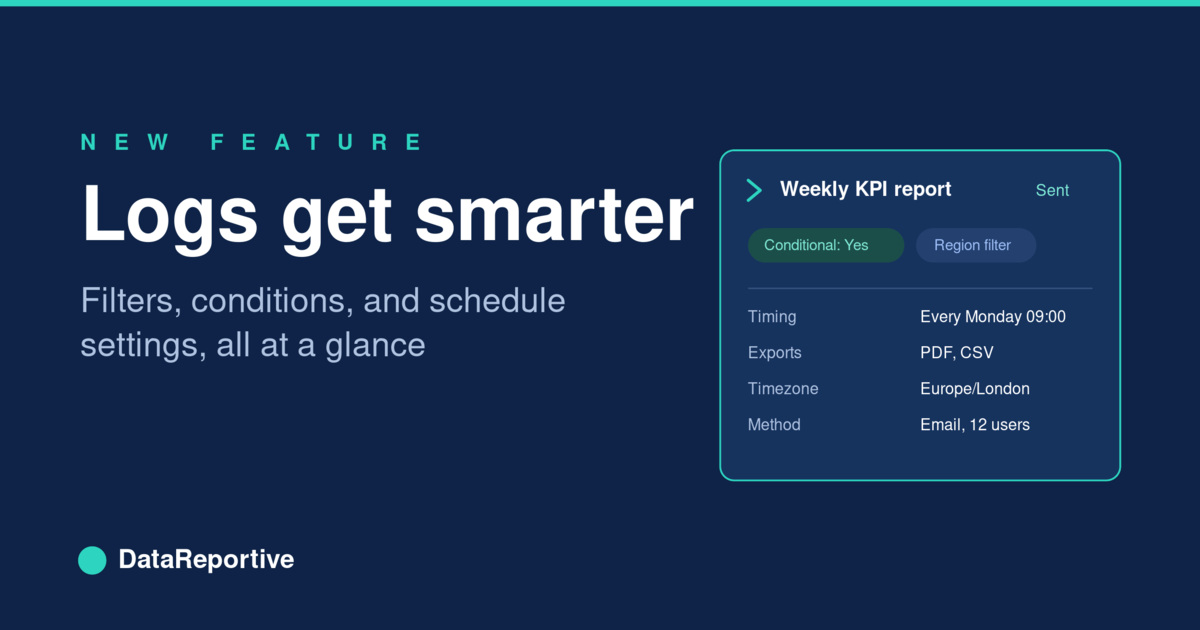
The report logs now show the full schedule configuration behind every scheduled send, so you can see exactly what was in effect at the moment the report went out, without leaving the page.
The problem with thin logs
Logs were always good at the basics. For any send, you could see when it ran, which report it was, who received it, the delivery method, and whether it succeeded or failed.
What they could not tell you was the detail that actually matters when you are troubleshooting or auditing:
- Which filters were applied for that specific send?
- Was it a conditional schedule, and if so, did the condition pass?
- What query and data source drove that condition?
- Which document and data exports were attached?
- What subject, message, timezone, and cadence were used?
To answer any of those, you had to leave the logs, find the schedule on the Schedules page, and read its current settings. The catch is that the current settings are not necessarily the settings used on the day in question. If anyone had edited the schedule since, you were looking at today's configuration and guessing whether it matched. That is a poor position to be in when finance is asking a precise question or you are pulling together a compliance review.
What is new: expandable scheduled sends
Every scheduled send row is now expandable. Look for the chevron on the left of the row, click it, and a detail panel opens up styled exactly like the schedule attributes you already know from the Schedules page. Same layout, same labels, nothing new to learn.
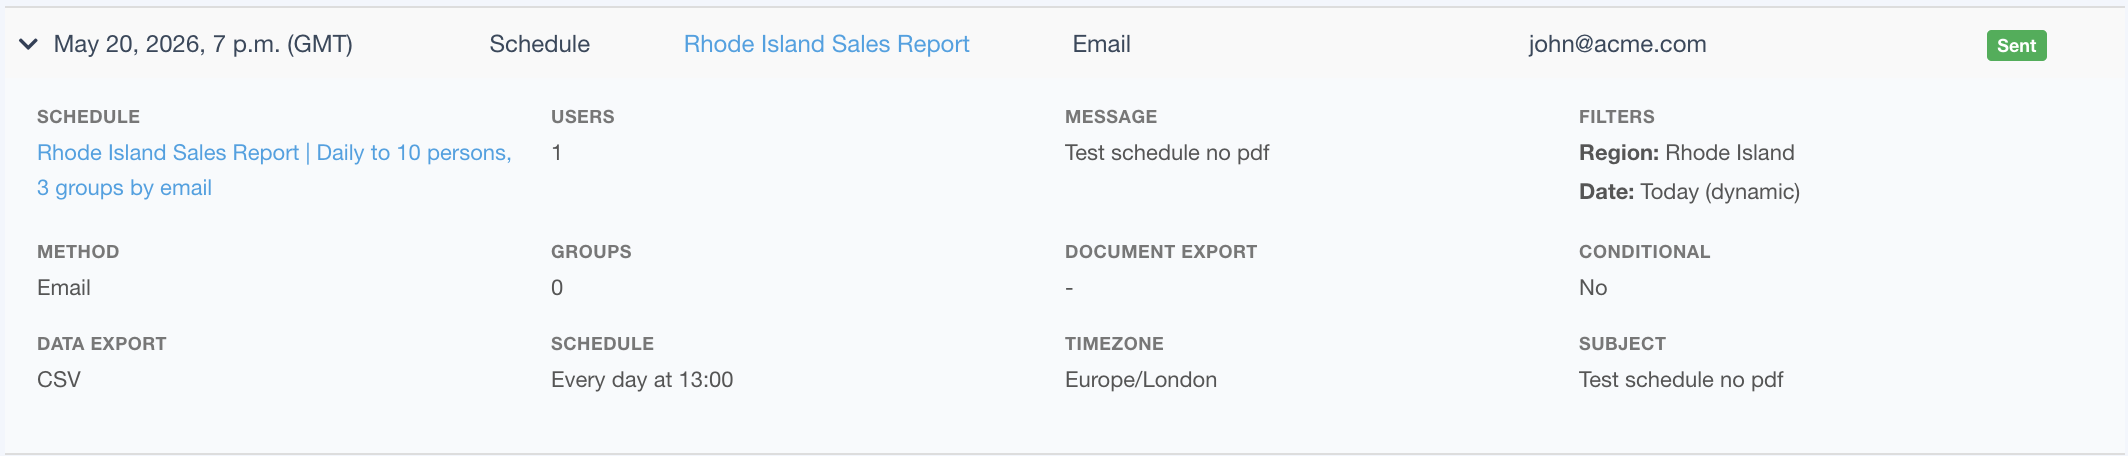
Here is what the expanded view shows:
- Schedule name, linked through to the schedule itself where it still exists
- Filters, including report defaults and any schedule-level overrides
- Conditional: Yes or No, with a summary of the condition (trigger, value, data source)
- Query evaluated, for conditional schedules
- Document export, such as PDF
- Data export, such as CSV or Excel
- Message and subject used for the send
- Schedule timing, for example "Every Monday at 09:00"
- Timezone
- Method, plus user and group counts, or Slack channels where relevant
In other words, the complete delivery configuration for that send, in one place, without cross-referencing anything.
A quick note on scope: this applies to scheduled sends. Manual, one-off sends are not tied to a schedule configuration in the same way, so they do not get the expanded panel. Everything about manual sends stays as it was.
Point-in-time accuracy
The most useful part is what happens behind the scenes. From now on, each scheduled send stores a snapshot of the settings that were used at the moment it ran. That snapshot lives with the log entry. If someone edits the schedule next week, the historical log entry does not change with it. You are always looking at what was actually true for that send, not what the schedule happens to say today.
For sends made before this update, we still do our best: if the original schedule still exists, the details are loaded on demand so you can see them. The snapshot applies to new sends going forward, which is exactly where it matters most for ongoing audits.
Where this helps
Debugging a conditional send that did not fire. A weekly KPI report did not go out. The log shows the status as "Condition not met". Rather than hunting through the schedule and trying to reconstruct what happened, you expand the row and see the exact query and threshold that were evaluated. The answer is right there: the condition genuinely was not met, and you can see why.
Verifying which filters were used. Finance asks which date range drove last month's regional report. You open the relevant log row and read the filter values from that specific send. Not the schedule's current filters, which may since have been changed, but the values that were actually applied on the day. The question is settled in seconds.
Checking recipients and overrides. A report reached an unexpected group, or a filter override behaved differently from what someone expected. Expanding the row shows the method, the recipient counts or channels, and the report defaults alongside any schedule-level overrides, so you can see precisely what was configured.
Bulk review with CSV export
For anything beyond a one-off check, the logs CSV export now carries three new columns: Schedule, Conditional, and Filters. That turns the logs into a proper review tool.
Running a quarterly compliance check? Export the logs, filter on Conditional = Yes, and you have every conditional send with its settings in a single sheet, ready to share or archive. The same applies to any internal review where you need a record of what went out and under which configuration, without clicking through rows one at a time.
Try it
- Open your report logs.
- Find a row where the report was sent on a schedule.
- Click the row to expand it using the chevron on the left.
- Review the filters, conditional settings, exports, timing, and recipients.
- For bulk review, download the CSV and work with the new Schedule, Conditional, and Filters columns.
Tip: Click any scheduled send in the logs to see the full delivery configuration, filters, conditions, exports, and timing, all in one place.
This is part of our wider push to make DataReportive easier to operate as you scale. The more reports you have running on a schedule, the more you need to trust and verify what is being sent. Log into your DataReportive account and try it.