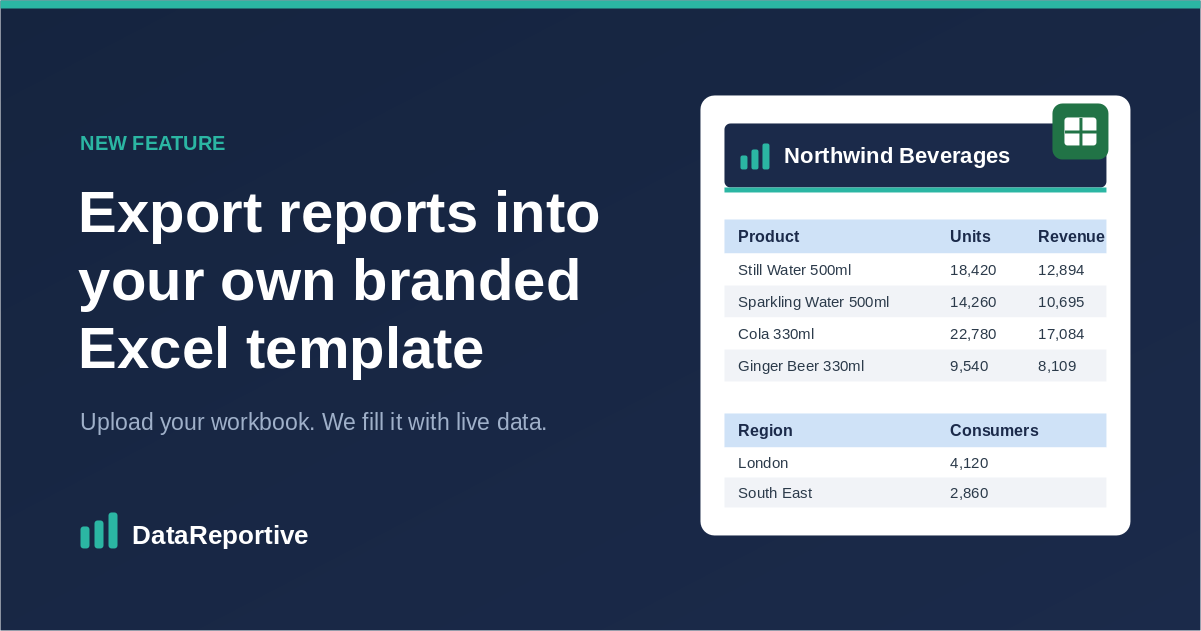
You can now export your reports into your own branded Excel workbook. Upload an empty .xlsx file with your logo, fonts and layout, tell each query exactly where to write in it, and DataReportive fills your design with live data every time you export or run a schedule. No more pasting query results into a template by hand.
If you have ever exported SQL data to Excel and then spent ten minutes adding a logo, fixing fonts and nudging tables into place, this is for you. Custom Excel templates let you design the layout once and have every export, manual or scheduled, come back already branded and formatted.
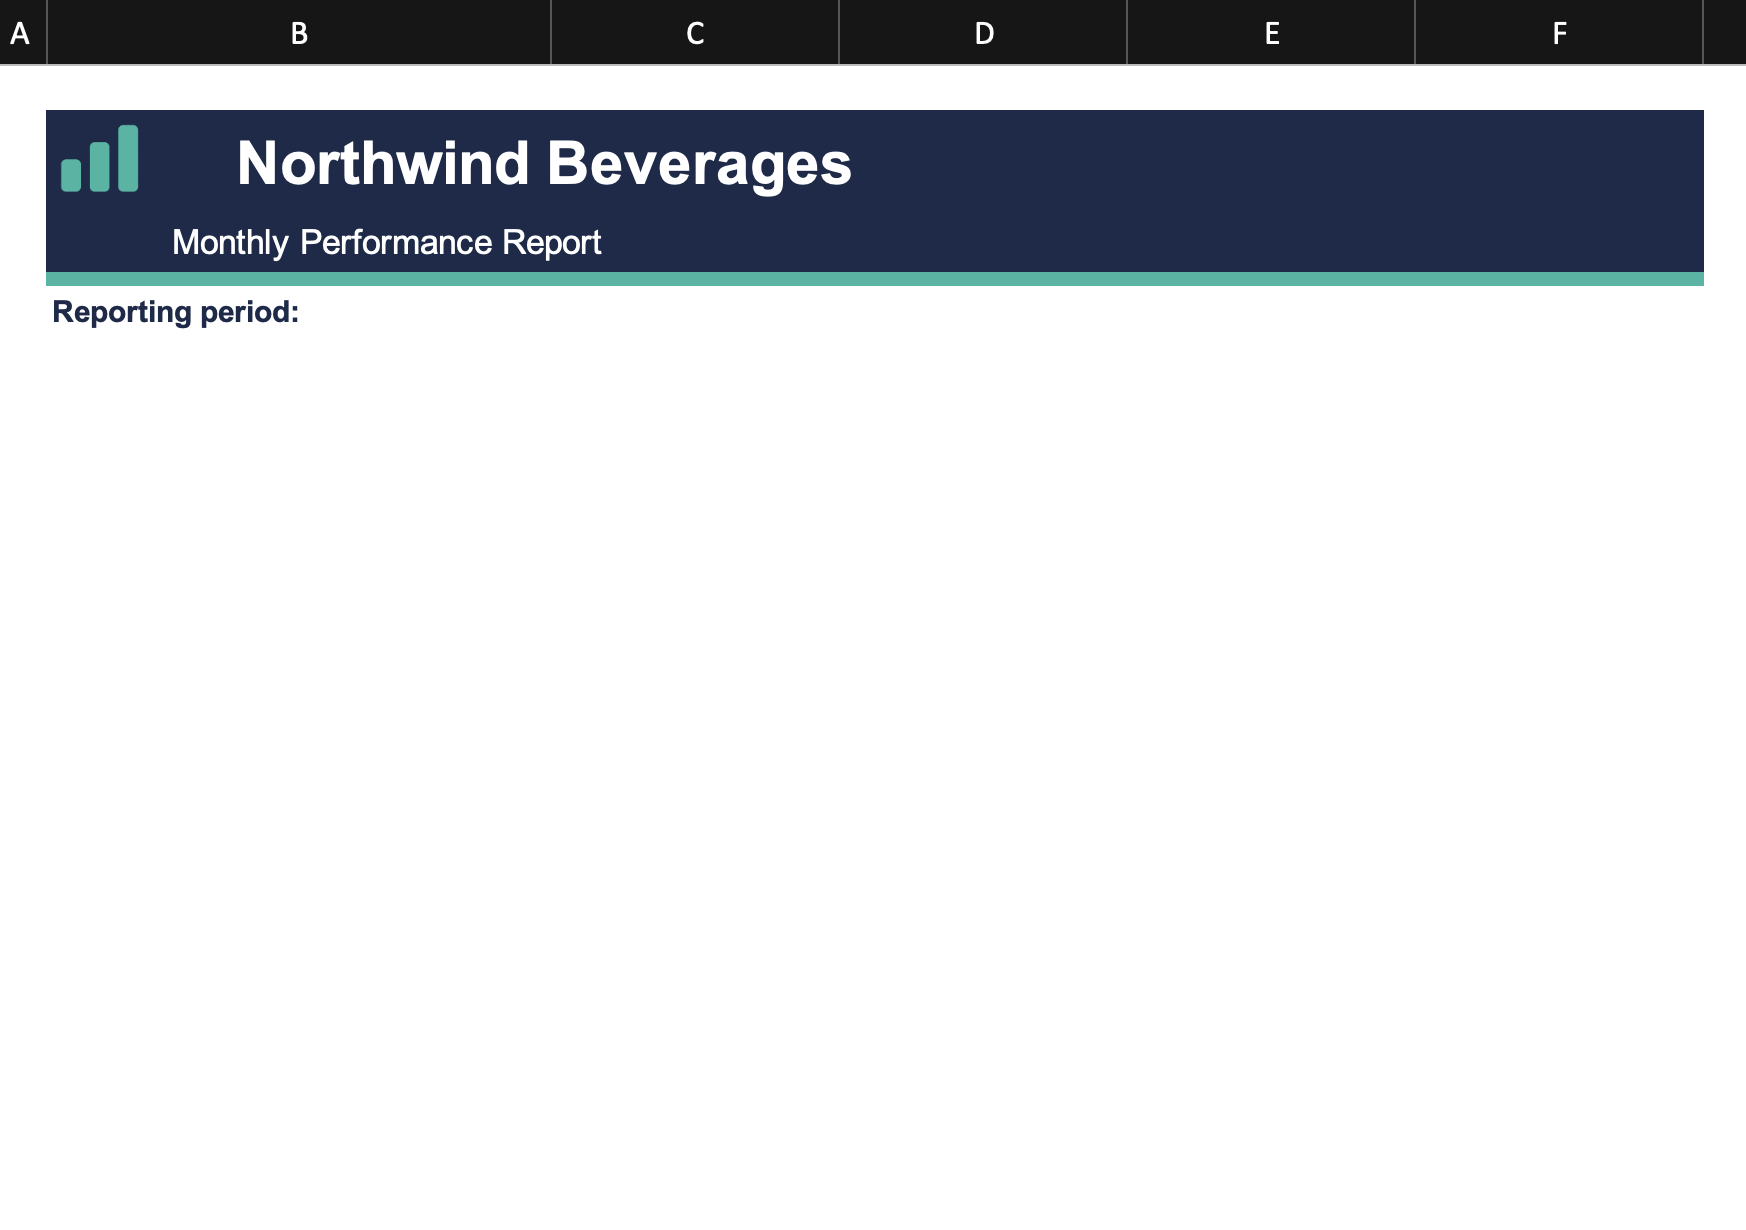
It starts with a workbook you have designed: your branding at the top, and the cells where data will land left empty.
Why export into your own Excel template?
The standard Excel export is quick and works exactly as before, producing a clean, generic worksheet. But a generic sheet is rarely what you send to a client, a board or a regulator. The moment the layout matters, you end up reformatting the same file by hand, every week, for every recipient.
A custom template removes that step. Your colours, fonts, logo and table positions are fixed in the workbook, and DataReportive only writes the data. Because the formatting lives in the template rather than in a one-off export, every scheduled Excel report looks identical, run after run, with no manual touch-up.
Who uses this, and when
Agencies and consultancies sending client-ready reports. Drop the client's branding into the template and deliver a polished Excel file that looks hand-built, without the hand-building.
Finance and operations teams producing board packs and management reports. Keep a fixed corporate layout with the right tables in the right order, so the monthly pack is consistent and instantly recognisable.
SaaS products embedding reporting. If you offer white-label exports to your own customers, a custom template lets each Excel download carry their branding rather than yours.
Teams on a schedule. Pair a template with a schedule and DataReportive emails a branded Excel file daily, weekly or monthly, straight from MySQL, PostgreSQL or any connected database.
Compliance and audit. When a report has to look the same every time and follow a set format, a fixed template removes the risk of a stray column or a missing header.
What you can do
- Upload an empty Excel file with your logo, fonts and layout.
- Place each query's headers and data in specific cells.
- Stack several tables on one sheet, one below another, so the lower table moves automatically with the row count of the one above it.
- Style header and data cells, including alternating row colours for zebra striping.
- Write different queries to different worksheets in a multi-sheet workbook.
When to reach for it
Use a custom template when you need a fixed corporate layout, several query results on one worksheet, tables in a set order, or consistent colours on exported data. For a quick data dump, the standard export is still the faster choice. If you mainly need on-screen analysis rather than a formatted file, email and PDF reports may suit you better.
How to turn it on
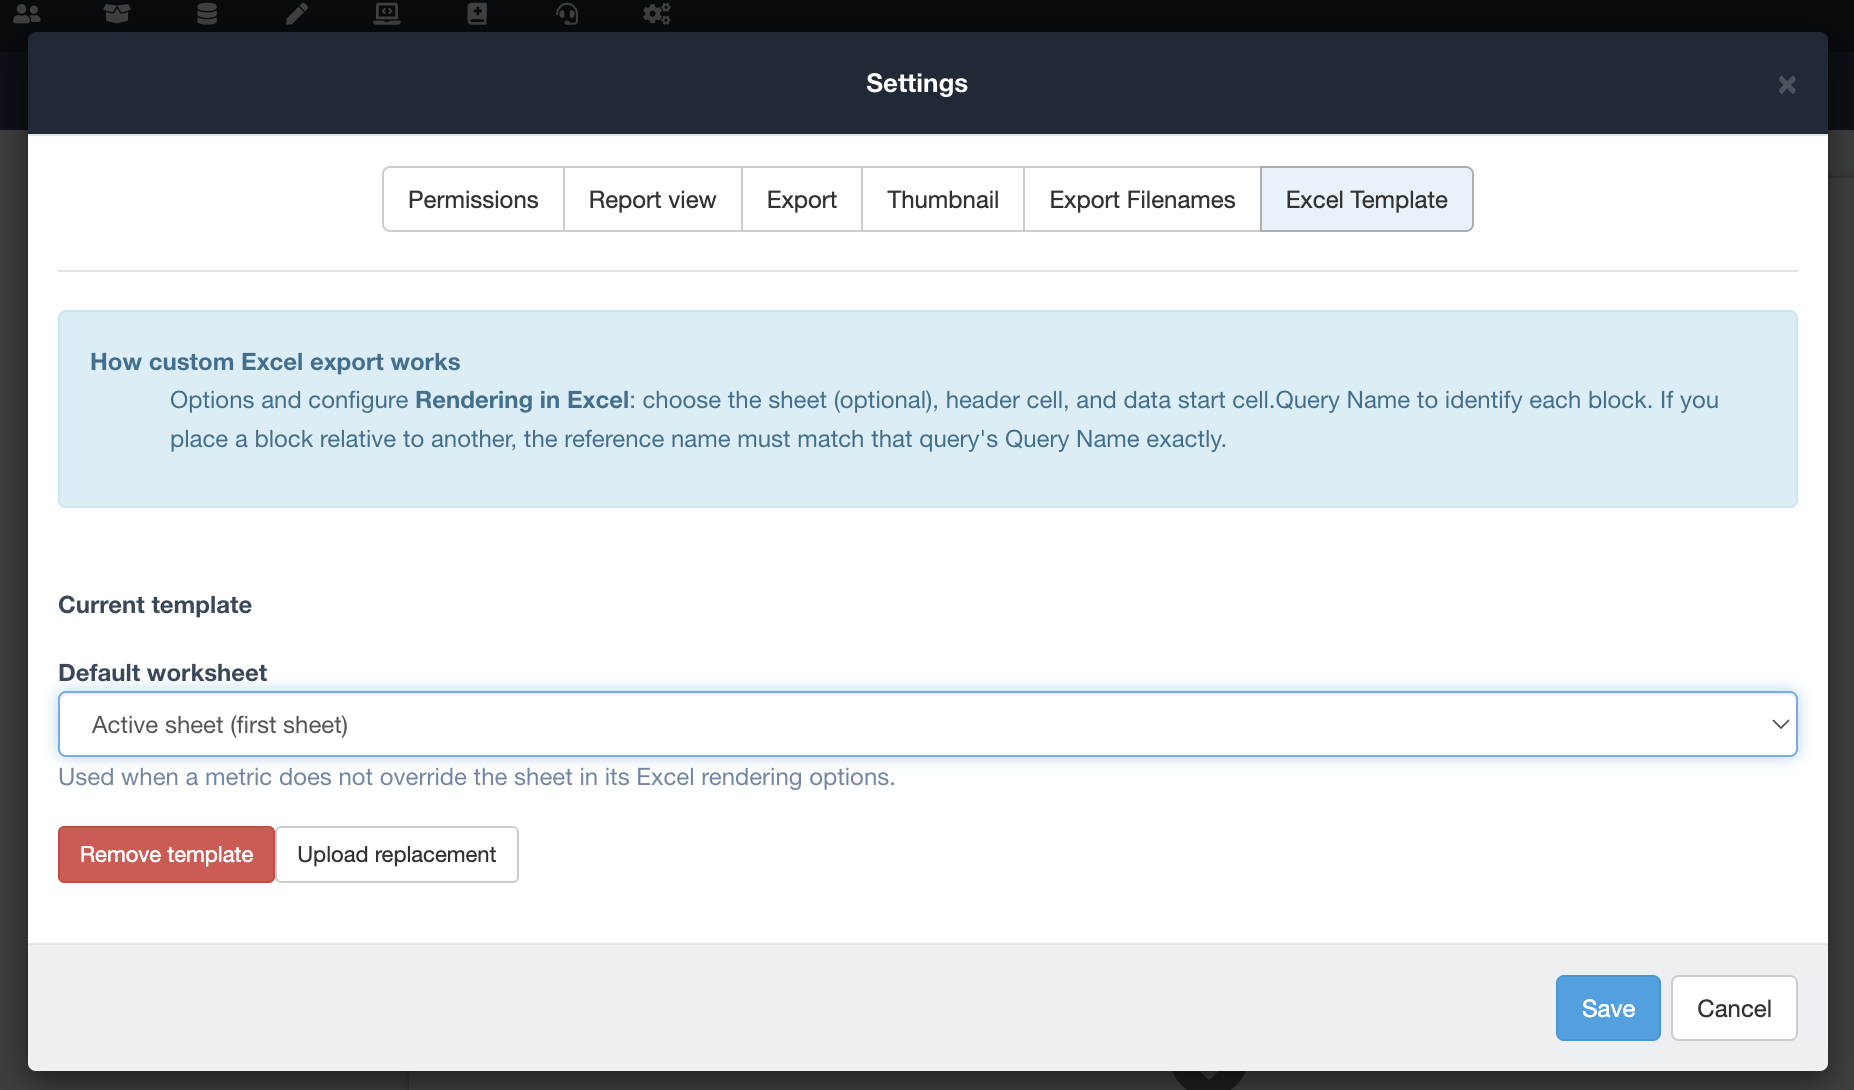
Inside any report, open Settings and go to the Excel Template tab to upload your workbook. If it has more than one sheet, pick a default worksheet, then save the report.
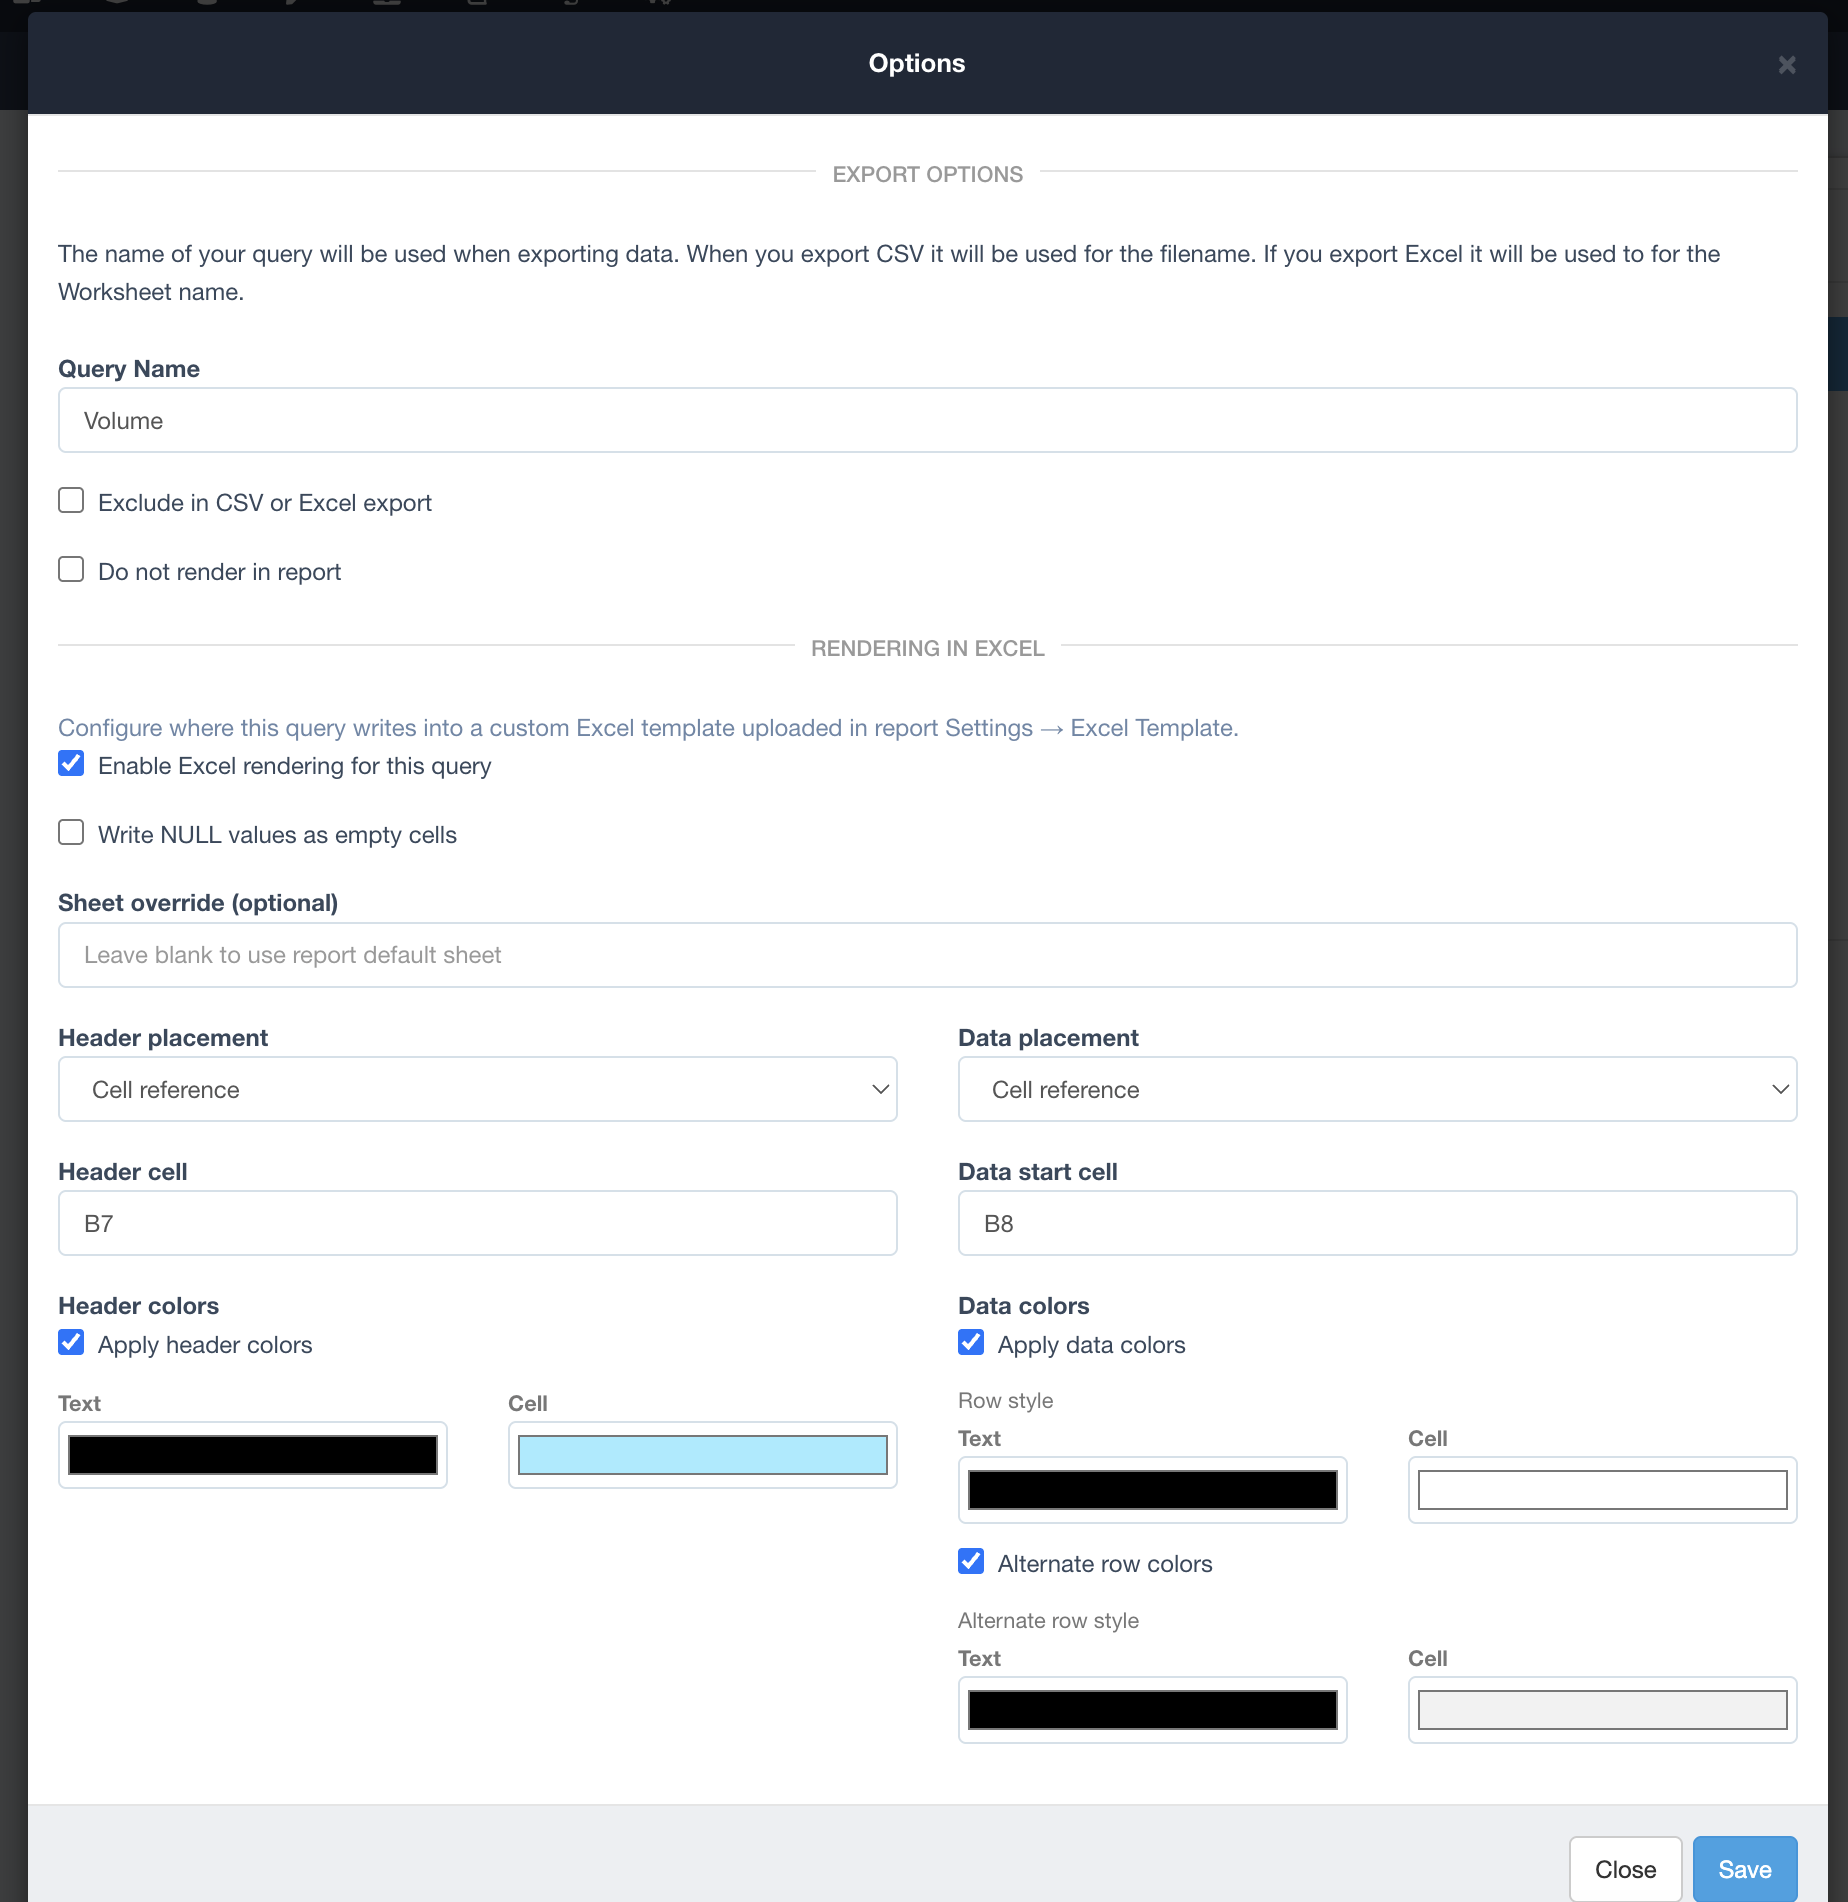
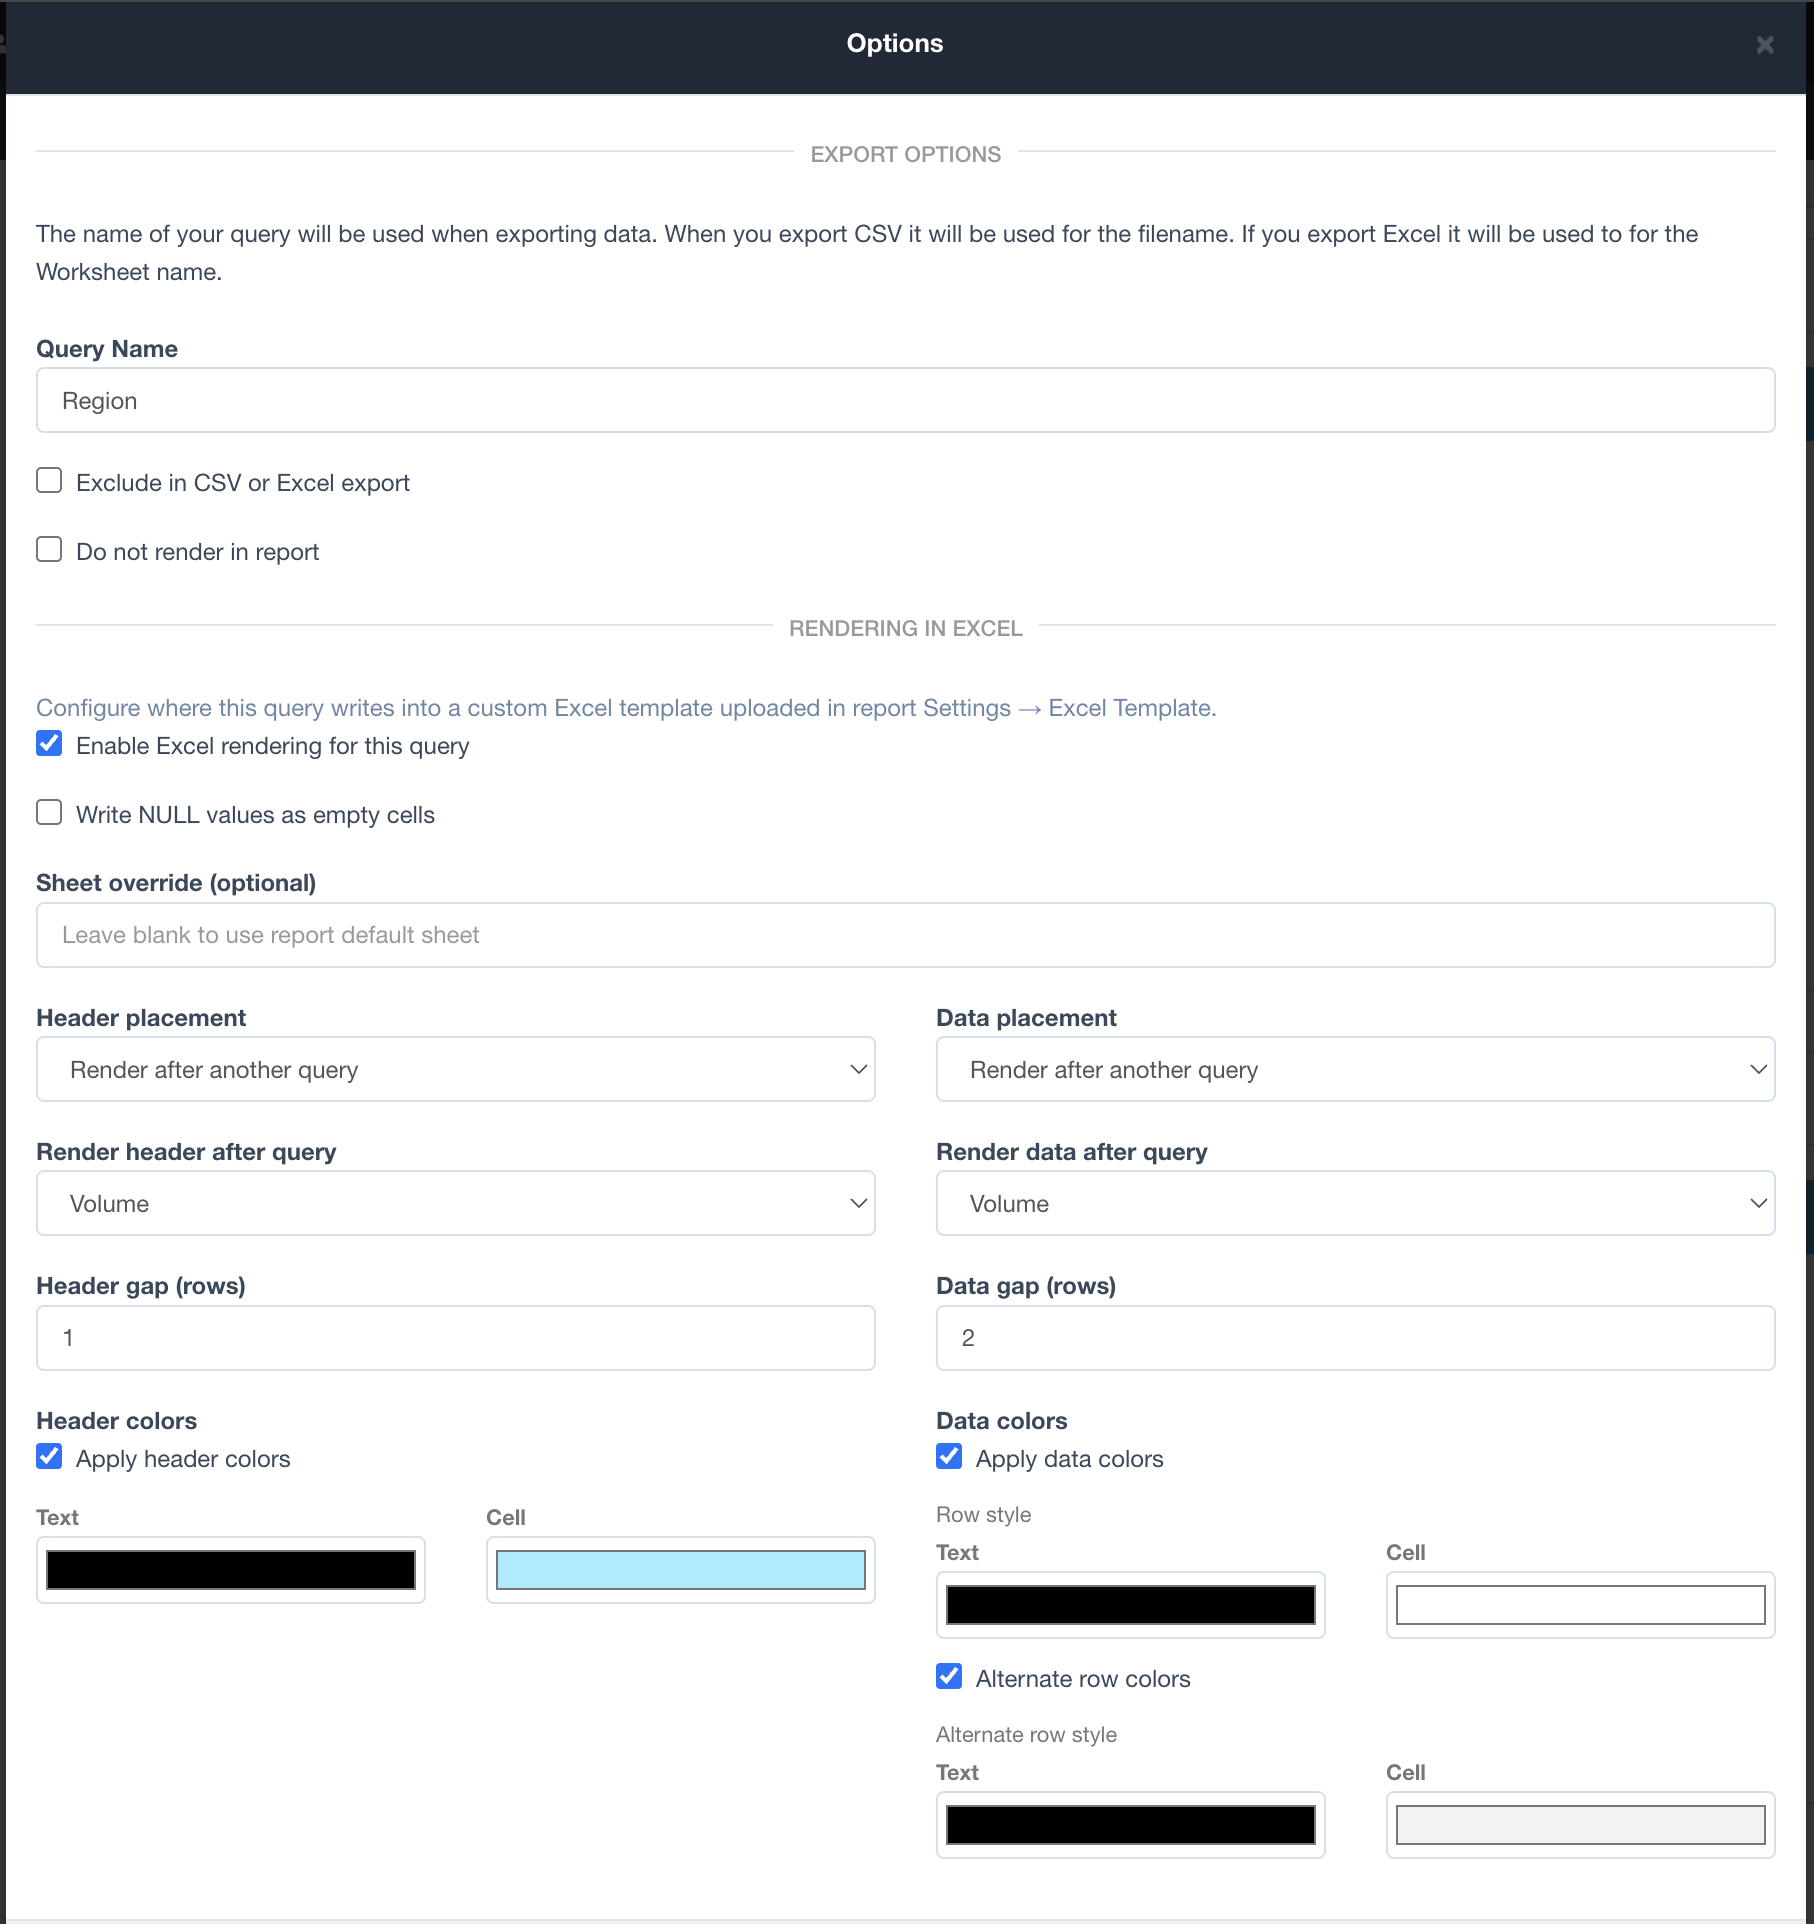
Then, on each query, open Options, give it a Query Name, and under Rendering in Excel tick Enable Excel rendering for this query. Set header and data placement either by cell reference or by rendering after another query, and optionally apply header and data colours. Save the Options dialog, then save the report.
A worked example: two tables on one sheet
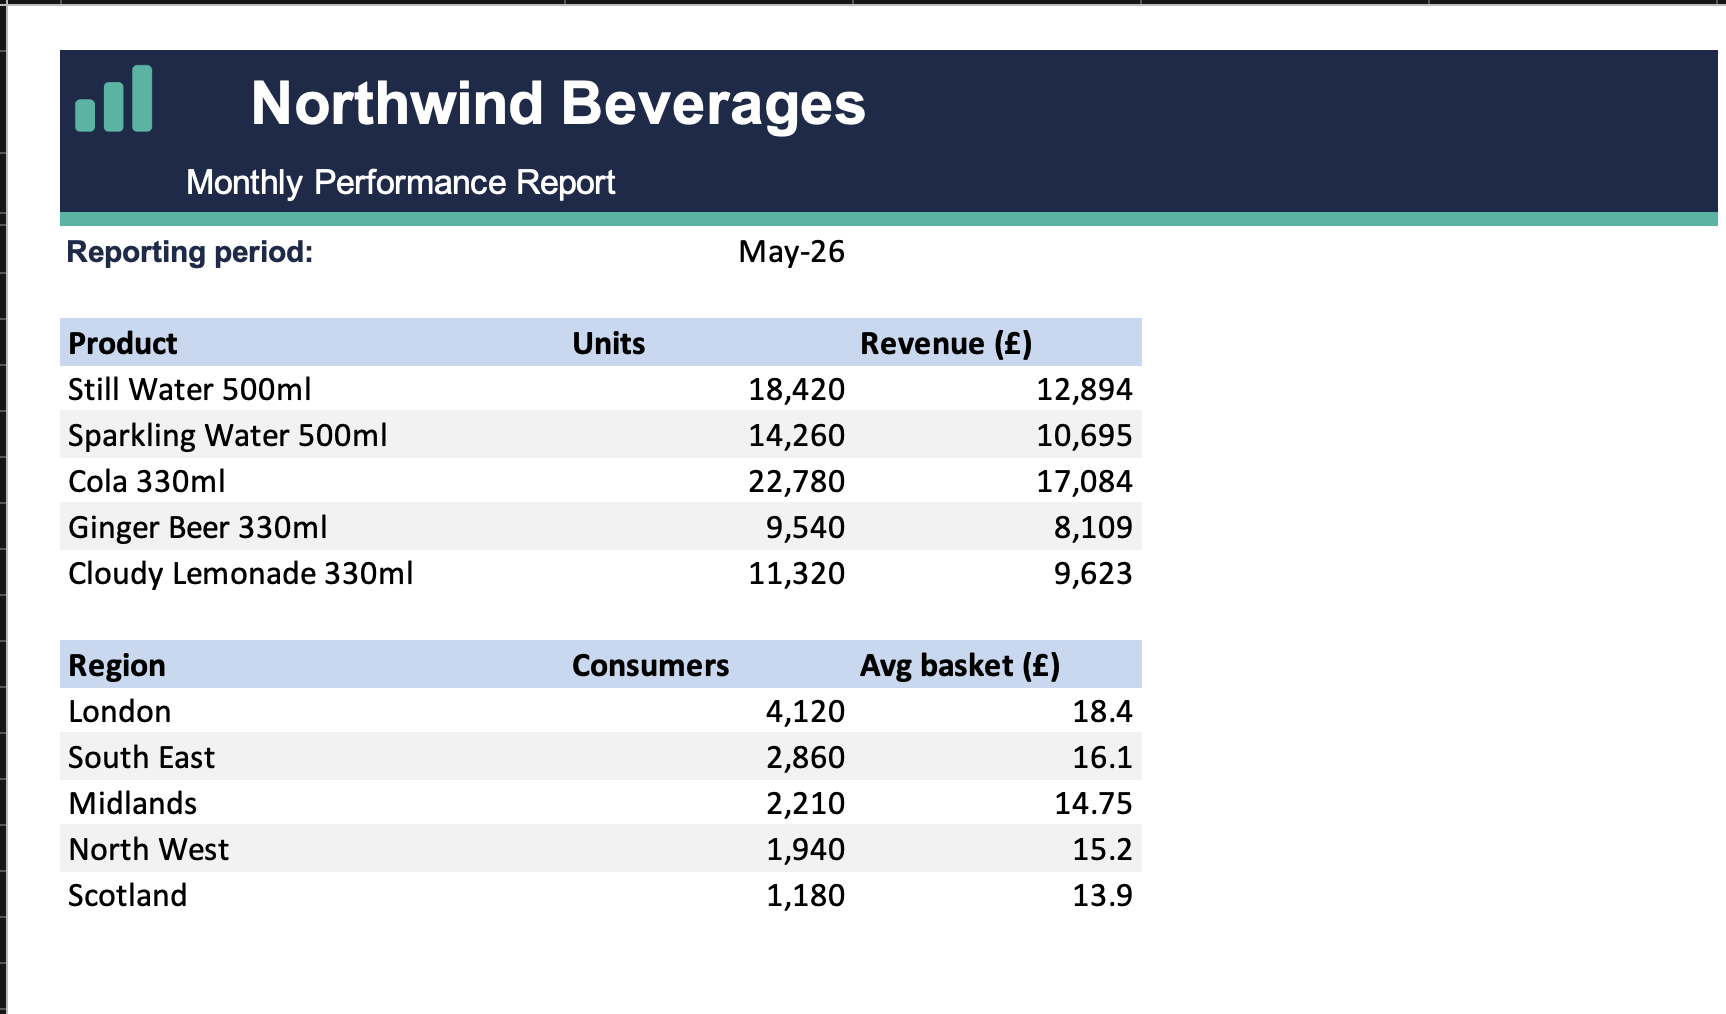
Say an imaginary company, Northwind Beverages, wants a branded monthly report in Excel. The report needs two tables on one sheet: units sold per product, and consumers per region. That is two queries, which we will call Volume and Region. Here is how to place them in the template.
Start with the Volume query. Give it the name Volume and place its headers in B7 and data in B8 using the cell reference option.
For the second query, Region, set both header and data placement to render after Volume, with a one-row header gap and a two-row data gap. The Region block then starts below Volume and shifts down automatically depending on how many rows Volume returns. No fixed cell maths, no overlapping tables.
Export to Excel, or attach Excel to a schedule, and the template comes back filled in, with your header colours and zebra striping applied:
Tips for a clean template
- Start with one query and fixed cells, then add more once it works.
- Use clear query names, since you will reference them when stacking tables.
- Leave the data cells empty in the template and let DataReportive apply header colours and zebra striping for consistent styling.
- Test with real data, because row counts affect where render-after blocks land.
- Save the report after changing a query's options, saving the dialog alone is not enough.
Frequently asked questions
Does a template change how my report looks on screen?
No. Uploading a template only affects the Excel export. The on-screen report and other export formats are unchanged, and you can remove or replace the template at any time.
Can I schedule a branded Excel export?
Yes. Any schedule that sends Excel will use the template, so recipients get the branded file automatically on your chosen cadence.
Which databases does this work with?
All of them. The template applies to the Excel export regardless of source, so it works with MySQL, PostgreSQL, SQL Server, Oracle, MongoDB, Redis and Timescale.
Can I put several tables on one sheet?
Yes. Place the first table at a fixed cell, then set later tables to render after it. Each block moves automatically based on how many rows the previous query returns, so tables never overlap.
Can I write to more than one worksheet?
Yes. Choose a default worksheet for the report, then use the sheet override on any query that should write to a different sheet in the same workbook.
The full step-by-step, including styling and multi-sheet setups, is in the docs.
Log into your DataReportive account and try it.